
Project Members: Sainikhil Naru & Richard Wang
Project Sponsor: Dr. Ali Mostafavi
Graduate Assistant: Hamed Farahmand
Flooding is the most common natural disaster and kills more people each year than tornadoes, hurricanes or lightning in the US, according to the National Severe Storms Laboratory (NSSL). As a result of global climate change, it is expected that the risk of flooding will increase in the near future disrupting lives and causing damages. One way to better manage this increasing flood risk, is to increase the situational awareness so the decision makers and residents living in the affected areas can stay informed on new developments. This can be done by taking in data from using hydrological data or aerial imagery, but such methods of data collection may take a substantial amount of time to validate and analyze. Instead in our study, we primarily focused on utilizing crowdsourced flood reports to develop a framework for calculating the severity of flooding in near real time.
The framework that we propose is done in three steps: (1) report collection, (2) clustering, (3) calculating severity. There are many sources for data collection, but the key attributes that stay consistent are the location coordinates and time the report or comment was made. After new data is received, a density based clustering algorithm is used on the reports to group points that are close together. This is because we are operating under the assumption that flood reports close together are likely from the same flood event. Then a severity score is generated that is dependent on the number of reports that occur inside of that cluster with priority given to how recently the report was made along with other factors such as the variance of the cluster and any duplicate reports.
Current Progress
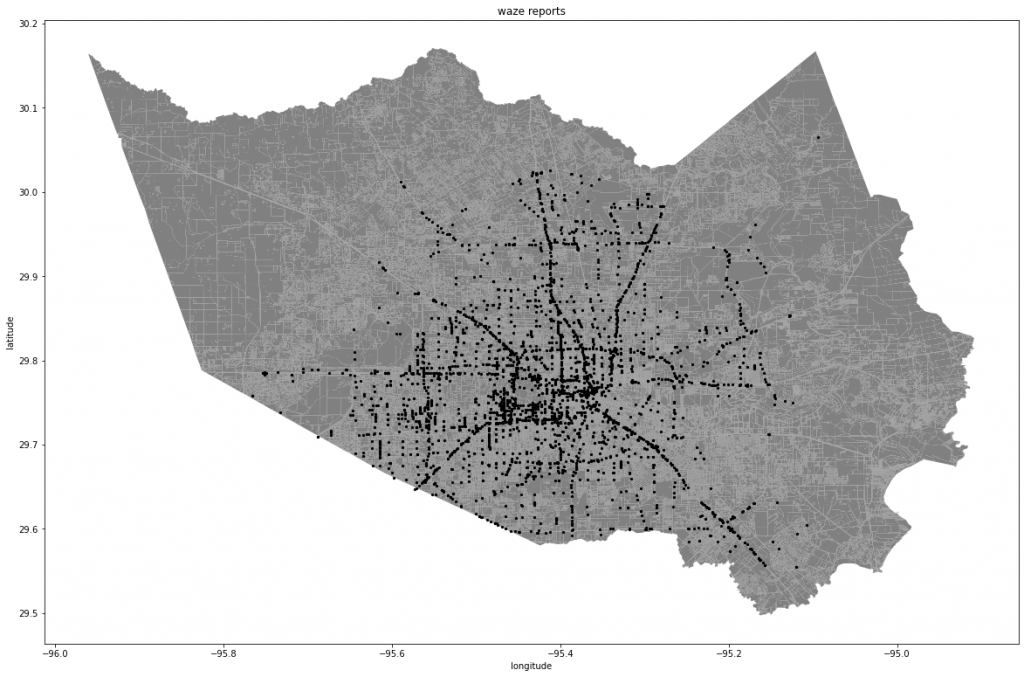
The dataset we are using as a case study are Waze Road Maps flood reports and Houston 311 (number for disasters) call data during Tropical Storm Imelda which occurred between September 17-September 21, 2019. First we cleaned the dataset for flood reports and data points that are within the time frame of Tropical Storm Imelda. Then we plotted this data onto a map of Harris County to visualize the data.
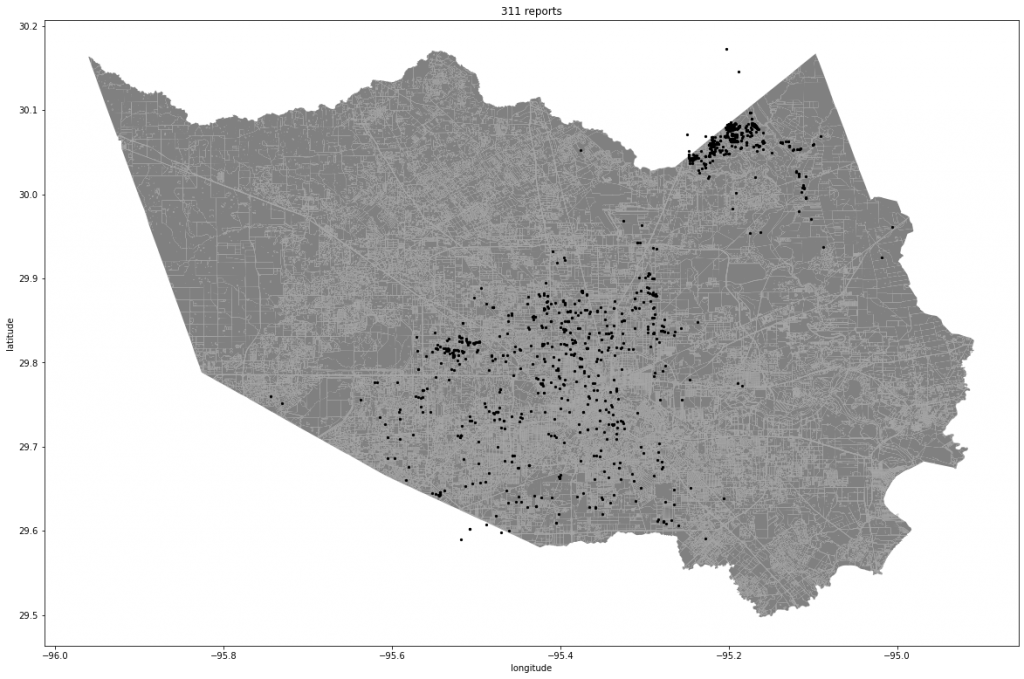
Figure 1.1: Visualization of all Waze and 311 reports 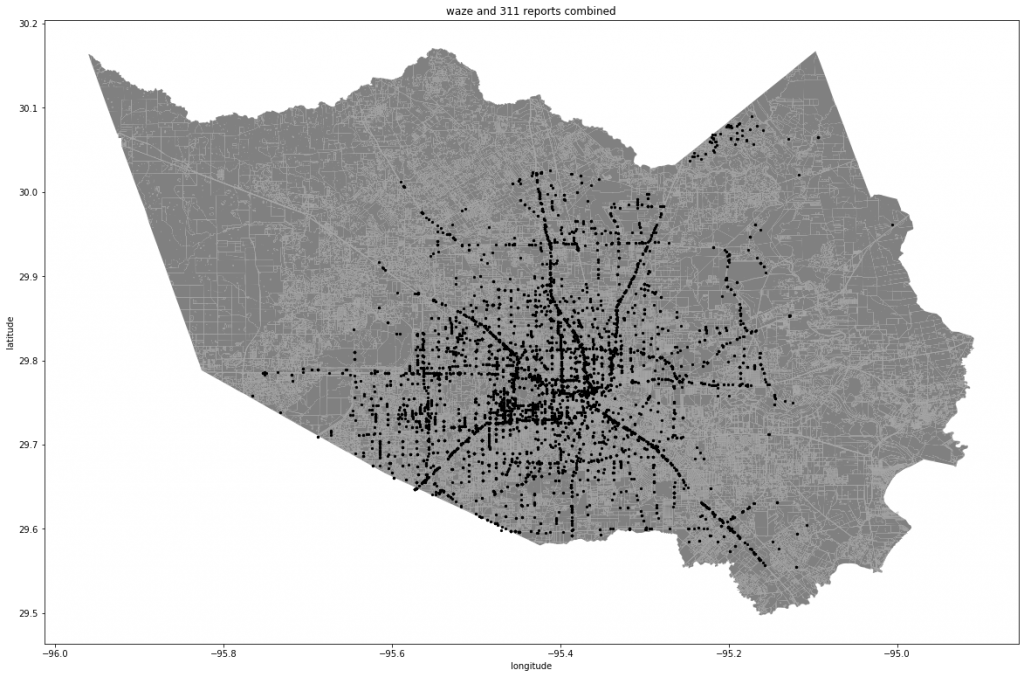
Figure 1.2: Visualization of all Waze and 311 reports
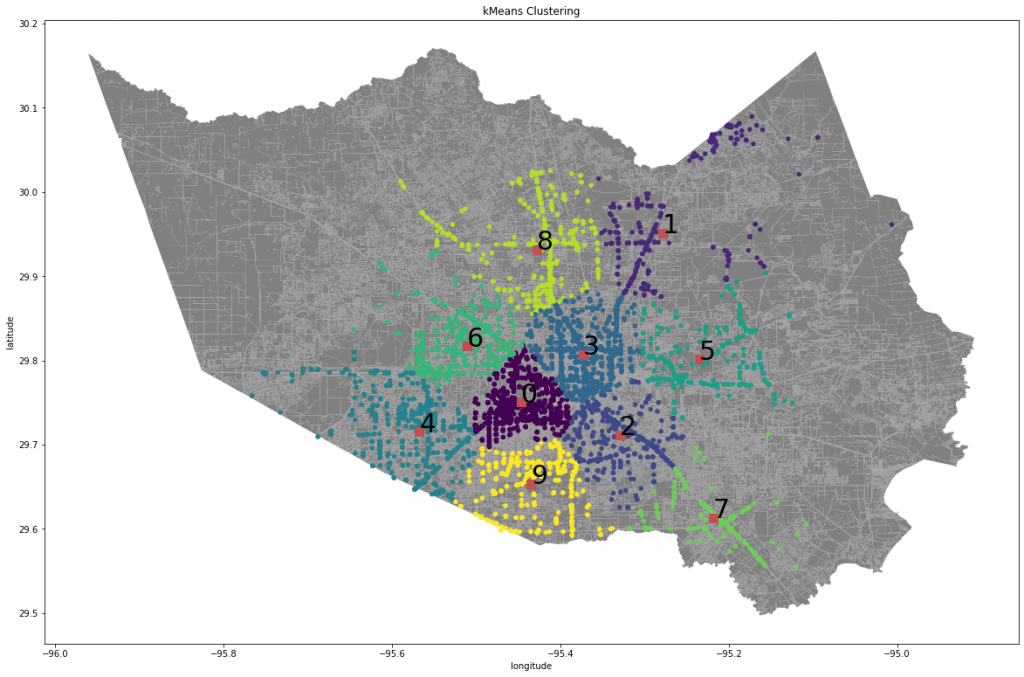
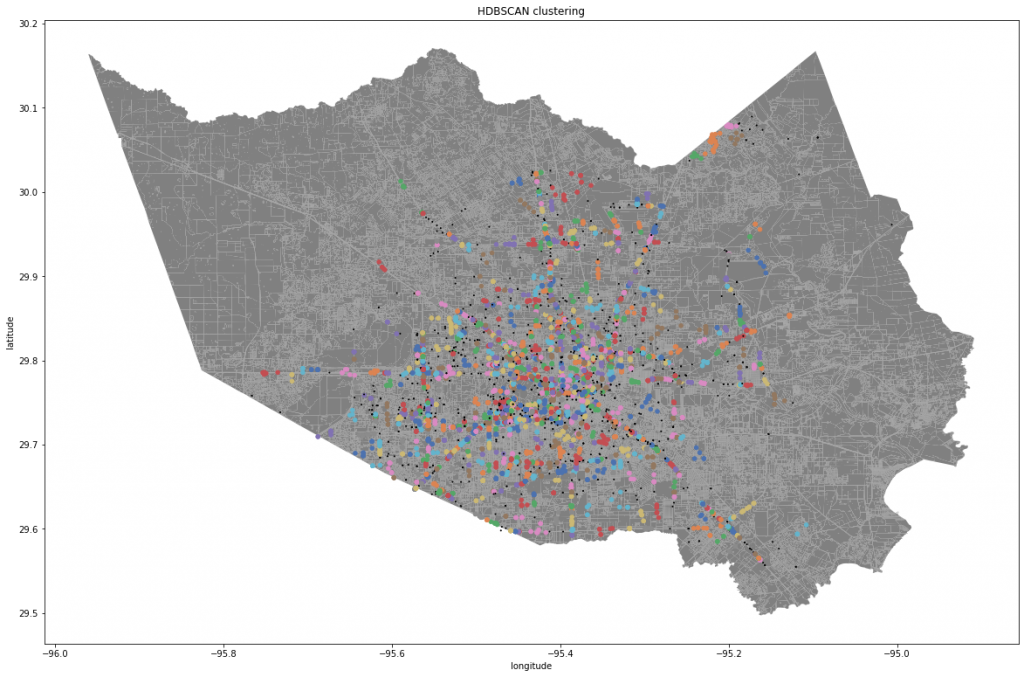
After the initial visualization, we clustered the combined dataset based on location coordinates using HDBScan for reducing outliers and Kmeans to generate the clusters that will be used to produce the severity score. We chose to do it this way since HDBScan is a hierarchical density based algorithm and sometimes the clusters are not as accurate using this method. This is where we used Kmeans to generate the clusters since it is primarily density based and will not have as many issues as just HDBScan. However, Kmeans does not select the number of clusters so it is necessary to use the elbow method. The elbow method runs the Kmeans algorithm multiple times with changing cluster sizes and calculates the average distance of all points to the cluster’s center point. The best cluster size is chosen when the average distance of each cluster doesn’t change as much as the previous number of clusters.
We have categorized the data points at specific time intervals within certain cluster groups ranked in order of increasing severity. Severity is determined by the number of points in a cluster, standard deviation, duplicate or report density and the time the report came in. Severity would be higher for points which are more recent and lower for older reports. Right now, we are in the process of finishing up the severity function to make it more accurate and more scalable.
Next Steps
We have outputted a visualization using the folium library to showcase flood severity across the map of Harris county. The severity score used for every point is updated and accurate till a certain probability. The next steps have to do more with fine tuning. Some possible ways to do this are normalizing the score column and adjusting the heuristic function for severity score. The heuristic function parameters were guessed through trial and error and we have to graph out respective parameters to find out the most optimal values to get the best results we can possibly get
Our visualization also needs to be formatted in a way where the audience and first responders can easily interpret the map to understand where the most severe regions of flood risk are located. For that to happen, we need to create a color bar on the map to label from 1 to the total number of clusters in the dataset so that we can target specific regions on the map.
Prediction is a key element that needs to be implemented so that given a few random or sample data reports, we can pinpoint which cluster a given flood report belongs to and assign a severity to it so we can understand the flood risk in that area. To check if our prediction is accurate, we need to split the initial dataset into training and test sets for validation so that we know if the results are not an outlier and close to the optimal values.
Some unique features to be added if time permits are to see if we can add poverty/income level of flooded neighborhoods to the severity score heuristic function. The function gets more and more closer to the actual answer the more impactful variables we add.
While making these changes, it is important to consider how long the elbow method is taking to calculate the most optimal cluster size number. If it is taking around 30 to 60 minutes, it might be a bit impractical to do it for 30 different time periods. Also another parameter to consider is the assumption that the inputted data frame has to be pre-processed before being used. This is important because if you input a data frame for analysis and visualization, you would not get the same results that we have gotten.
Figure 1.1: Visualization of all Waze and 311 reports Figure 1.2: Visualization of all Waze and 311 reports Figure 2: Visualization of all reports during Imelda Figure 3: Kmeans visualization of all combined flood reports with 10 clusters Figure 4: HDBSCAN of all combined flood reports Figure 5: Severity Score Gif over the first 15 time periods
Recent Comments